Validation Guide
A guide to MolProbity's validation metrics, how they are reported, and how to interpret them.
Scoring
MP-Triage Score
Per-residue priority ranking — which residues to look at first
Overview
The MP-Triage score is a per-residue priority signal designed to answer "which residues should I look at first?" It is not a quality metric or an outlier count — it is a triage ranking. Higher scores indicate more urgent problems.
How the score works
Each validation finding for a residue is assigned a severity reflecting how alarmed an experienced crystallographer would be. The score is then computed using a worst-finding-dominates rule:
score = worst_severity + 0.25 × sum(remaining_severities)
The worst problem drives the score. Additional findings contribute at 25%, adding signal without swamping a severe single issue. This ensures a twisted peptide always outranks any accumulation of minor clashes, even though the minor clashes do contribute. The result is shown to one decimal place — this is intentional, to make clear that it is not a count.
Color scale
| Score | Color | Interpretation |
|---|---|---|
| 0 | ███ Green | No validation issues found |
| 0.1 – 3.0 | ███ Yellow | Minor issues — worth reviewing but not alarming |
| >3.0 | ███ Red | Serious issues — examine these first |
Severity reference
Approximate severities assigned to common validation findings:
| Finding | Severity | Notes |
|---|---|---|
| Twisted peptide | 15 | Almost always wrong |
| Chirality inversion | 10 | L↔D swap, essentially never correct |
| Cis non-proline | 8 | Very rare, usually an error |
| Rama outlier | 5 | ~0.3% in good structures |
| Tetrahedral geometry | 5 | Distorted chiral volume |
| Clashes | 1–10 | Scales with overlap magnitude; count adds diminishing bonus |
| Arg χ5 twist | 1–10 | Rises with sin² of the twist past 20°; stays below a twisted peptide |
| N-acetyl / Asn-glycan link twist | 1–10 | Same curve as Arg χ5 |
| Rotamer outlier | 3 | ~1–2% in good structures |
| CaBLAM outlier | 3 | Backbone peptide plane problem |
| RNA suite / pucker outlier | 3 | |
| Cβ deviation | 1–7 | Scales with deviation magnitude |
| Bond / angle outliers | 1–4 | Scales with sigma |
| Planarity outlier | 1–4 | As bond / angle outliers; a ring tilt scales with tilt over its limit |
| CaBLAM disfavored | 1 | Minor concern |
Usage notes
Sort the residue table by MP-Triage descending to see the highest-priority problems first. Red residues should be examined before yellow ones.
The score is a relative ranking, not an absolute quality measure. A score of 5 does not mean "five things wrong" — it means the worst finding alone carries severity 5. The open-ended scale ensures severe problems always stand out.
As with all validation metrics, outliers are not necessarily errors. A genuine Ramachandran outlier supported by clear electron density is real, even though it increases the triage score. Use the score to prioritize investigation, not to mandate changes.
Universal Validations
Clashes and Clashscore
Steric overlaps ≥0.4Å between non-bonded atoms
Overview
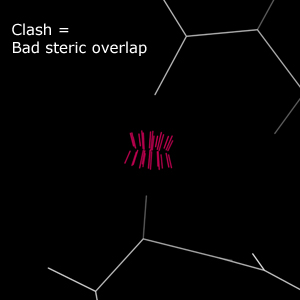
Clash analysis is one of the signature validations offered by MolProbity. "Clashes" are steric overlaps of 0.4Å or greater between non-bonded atoms. Such interactions carry a severe energy penalty and should be avoided.
All-atom contact validation of ligands is not comprehensive. Reduce adds hydrogens to ligands based on the PDB hetdict library, which may not contain recent additions or novel ligands. Ligands without complete hydrogens cannot be fully assessed.
Results table
MolProbity identifies individual clashes and provides an overall "clashscore" for the structure. Clashscore approximates the overall severity of clashes in a structure.
- Mild clashes are steric overlaps ≥0.4Å but <0.5Å.
- Most clashes are displayed at the standard outlier level.
- Severe clashes are steric overlaps >0.9Å or ≥4 clashes per residue.
Relationship to the classic MolProbity clashscore
The clashscore reported here uses the same definition as the original MolProbity server, but is computed with the next-generation reduce2 (hydrogen placement) and probe2 (all-atom contact) engines rewritten as part of the CCTBX ecosystem. Because hydrogen placement and contact-dot calculation are handled by these newer tools, the clashscore for a given structure may differ slightly from the value produced by the classic MolProbity server. The two are closely comparable but should not be expected to match exactly.
This also affects the MolProbity score, which combines the clashscore with rotamer and Ramachandran statistics — any difference in the clashscore propagates into that combined score as well.
Kinemage
In the kinemage, clashes are displayed as hot pink spikes between atoms. The "Bad Overlap" button shows clashes ≥0.4Å but <0.5Å. The "Worse Overlap" button shows clashes ≥0.5Å.
Usage notes
Clash analysis is one of the most sensitive methods for identifying problems in structures and should always be used. In difficult structures, it may be necessary to focus on more severe overlaps rather than the mild clashes. In high-resolution structures, mild clashes should be attended to with the same care as more severe ones.
References
Word, J. M., Lovell, S. C., LaBean, T. H., Taylor, H. C., Zalis, M. E., Presley, B. K., Richardson, J. S. & Richardson, D. C. (1999). Visualizing and quantifying molecular goodness-of-fit: small-probe contact dots with explicit hydrogen atoms. J. Mol. Biol., 285(4), 1711-1733. doi:10.1006/jmbi.1998.2400
Chen, V. B., Arendall, W. B., Headd, J. J., Keedy, D. A., Immormino, R. M., Kapral, G. J., Murray, L. W., Richardson, J. S., & Richardson, D. C. (2009). MolProbity: all-atom structure validation for macromolecular crystallography. Acta Cryst. D, 66(1), 12-21. doi:10.1107/S0907444909042073
Hydrogen Bonds
Favorable polar contacts that stabilize macromolecular structure
Overview
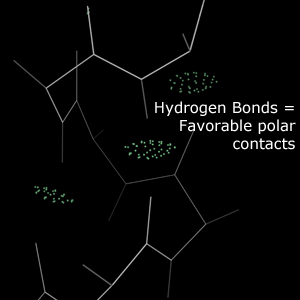
Hydrogen bonds are close contacts between polar atoms and hydrogen atoms. These contacts are energetically favorable and play an important role in stabilizing macromolecular structures. Hydrogen bonds are expected in protein secondary structure, between RNA bases, and elsewhere.
Kinemage
In the kinemage, hydrogen bonds are represented as "pillows" of greentint dots between the bonding atoms. These dots fall on the surfaces of the bonding atoms' van der Waals spheres. A larger overlap indicates a stronger bond and is represented by a larger "pillow".
Usage notes
Regular hydrogen bonding patterns define protein secondary structure and RNA base pairing. Weak or missing bonds in these positions may indicate modeling errors.
References
Word, J. M., et al. (1999). Visualizing and quantifying molecular goodness-of-fit: small-probe contact dots with explicit hydrogen atoms. J. Mol. Biol., 285(4), 1711-1733. doi:10.1006/jmbi.1998.2400
van der Waals Contacts
Non-bonded contacts indicating packing quality
Overview
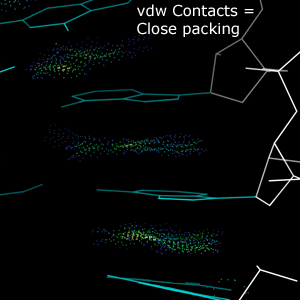
van der Waals contacts are close contacts between non-bonding atoms. Contacts between hydrophobic surfaces, especially in the interior of a structure, are generally favorable.
Kinemage
In the kinemage, van der Waals contacts are represented by dots between atoms in a variety of colors. Cool-colored dots (blues and greens) indicate favorable packing. Warm-colored dots (yellow, orange, red) indicate small steric overlaps that do not rise to the level of clashes.
Usage notes
Sparse van der Waals contacts may indicate underpacking in a model. For very large structures, the proliferation of vdW contact dots may slow down kinemage navigation; they are therefore automatically turned off for large structures.
References
Word, J. M., et al. (1999). Visualizing and quantifying molecular goodness-of-fit. J. Mol. Biol., 285(4), 1711-1733. doi:10.1006/jmbi.1998.2400
Deis, L. N., Verma, V., Videau, L. L., Prisant, M. G., Moriarty, N. W., Headd, J. J., Chen, V. B., Adams, P. D., Snoeyink, J., Richardson, J. S., & Richardson, D. C. (2013). Phenix/MolProbity hydrogen parameter update. Comp. Cryst. Newsletter, 4, 8-10. PDF
Bond Geometry
Bond lengths, angles, and chiral volumes vs. expected values
Overview
Geometry evaluation checks covalent bond lengths, covalent bond angles, and chiral volumes against expected values. For proteins, expectations are established by Engh and Huber. For RNA, bond lengths and angles depend on the pucker of the ribose sugar and are checked against pucker-specific values. Bond lengths and angles deviating from expectations by more than 4σ are considered outliers.
Covalent geometry validation of ligands is not comprehensive. It is based on the Phenix geostd and mon_lib libraries, which may not contain recent or novel ligands.
Results table
The worst geometry outlier for each residue is reported. Most outliers (4σ to 10σ) are displayed at the standard outlier level. Particularly severe outliers (≥10σ) are displayed at the severe level.
Kinemage
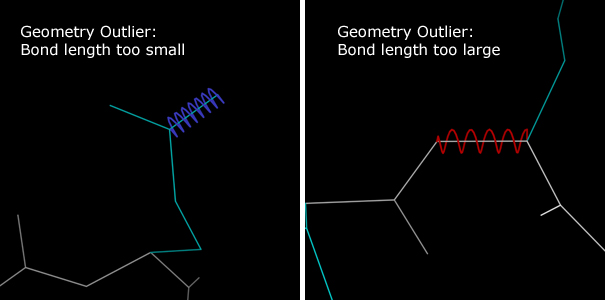
Bond length deviations are marked with colored springs along the deviant bonds:
- Compressed blue springs — bonds that are too short
- Extended red springs — bonds that are too long
Bond angle deviations are marked with colored fans:
- Widening blue fans — angles that are too small
- Narrowing red fans — angles that are too wide
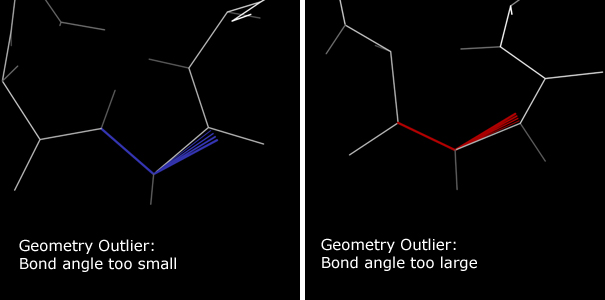
Chiral volume outliers are marked with yellow cages outlining the chiral volume. Tetrahedral geometry outliers have a ball at the chiral center and often appear flattened. True chiral identity swaps also have an arrow from the chiral center, suggesting a mirror operation.


Usage notes
Bond geometry validation is always recommended. The expected values are well-established, and deviations are generally serious.
Warning: Bond geometry in ligands may be identified as outliers without cause, since ligand geometries are not as well defined as protein and RNA geometries.
References
Engh, R. A., & Huber, R. (1991). Accurate bond and angle parameters for X-ray protein structure refinement. Acta Cryst. A, 47(4), 392-400. doi:10.1107/S0108767391001071
Engh, R. A., & Huber, R. (2001). Structure quality and target parameters. International Tables for Crystallography Volume F, pp. 382-392. doi:10.1107/97809553602060000695
Planarity
Atoms out of the plane of a group that should be flat
Overview
Aromatic rings, amides, the peptide bond, the guanidinium and nucleic acid bases are held flat by conjugation. Each such group is fitted with a best-fit plane, and a group is an outlier when any of its atoms lies more than 4σ from that plane.
Only amino acids, nucleotides and N-acetyl sugars are checked. Other ligands are not yet: cofactors such as flavins and hemes bend or ruffle for real, and how their planes are defined varies.
Rings in amino acids and nucleotides are judged in two parts. The ring atoms are held to 4σ against the plane of the ring alone. Each atom hanging off the ring (CB of Phe, Tyr, Trp and His; C1′ and the O, N and methyl substituents of a base; the Tyr OH) can bend out of that plane more easily than a ring atom can move, so it is judged by the angle of its bond instead: an outlier past 7°, or 11° for C1′, limits that about 0.5% of well-ordered rings in high-resolution structures exceed. The tilts are only judged when the ring itself passes.
Hydrogens are not judged: in X-ray models they are placed rather than measured, and leaving them out gives the same result whether or not the file includes them.
Results table
- The residue charged with the outlier is the one holding the atom that is out of place.
- Planes past 10σ are flagged at the severe level.
- Search the residue table for
planto list residues with an outlier plane. - The distance shown is that atom's distance from the plane through the rest of the group, which is closer to how far it actually moved than the deviation from the full fit, since one bad atom also tilts the full fit.
- The Arg CD is left out of the guanidinium plane, because its twist is reported separately as Arg χ5. For the same reason a sugar's ring carbon is left out of its N-acetyl plane (N-acetyl twist), and an N-linked sugar's C1 out of the Asn amide plane (Asn-glycan link twist).
Outliers count toward the MP-Triage score.
Kinemage
Each outlier group is filled in pink along its bonds, and a red pin runs from the plane to the atom that is out of it. For four-atom groups such as amides and the peptide bond, the pin is on the central atom, which reads as a pyramidal center. When no single atom explains the distortion, as in a puckered ring, every atom past 4σ gets a pin. A tilted atom gets a red wedge from its ring atom instead, between where the bond should lie and where it is.
Protein Validations
Ramachandran Evaluation
Backbone φ/ψ dihedral evaluation — Favored, Allowed, Outlier
Overview
Ramachandran validation is a long-standing evaluation of protein backbone conformation using the φ and ψ backbone dihedrals. Residues are assigned to one of three categories: Favored, Allowed, and Outlier.
Results table
The Favored/Allowed/Outlier status of each residue is reported.
- Outlier residues are flagged as outliers.
- Allowed residues are noted but not flagged. About 2% of residues are expected to fall within the Allowed region, so these are not necessarily wrong, but require inspection.
Kinemage
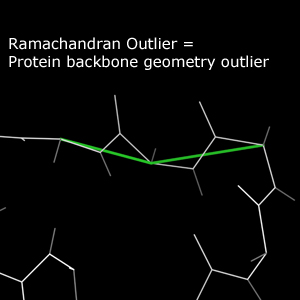
Outlier residues are marked with a green line following the Cα trace near the outlier.
Usage notes
Ramachandran validation is broadly applicable. However, in structures with large or many contiguous modeling errors, Ramachandran analysis can become overwhelmed. In such cases, consider CaBLAM validation for an analysis better suited to difficult models.
References
Ramachandran, G. N., Ramakrishnan, C., & Sasisekharan, V. (1963). Stereochemistry of polypeptide chain configurations. J. Mol. Biol., 7, 95-99. doi:10.1016/S0022-2836(63)80023-6
Lovell, S. C., Davis, I. W., Arendall, W. B., de Bakker, P. I., Word, J. M., Prisant, M. G., Richardson, J. S., & Richardson, D. C. (2003). Structure validation by Cα geometry: φ, ψ and Cβ deviation. Proteins, 50(3), 437-450. doi:10.1002/prot.10286
Rotamer Evaluation
Sidechain conformations checked against known rotamer library
Overview
Protein sidechain geometry generally exhibits discrete conformations called "rotamers." Sidechains that do not fall within the bounds of a rotamer definition are considered outliers. Like Ramachandran analysis, rotamer analysis assigns sidechains to Favored, Allowed, and Outlier categories.
Results table
- Outlier sidechains are flagged.
- Allowed sidechains are noted. About 2% of sidechains are expected to fall within the Allowed region.
Kinemage
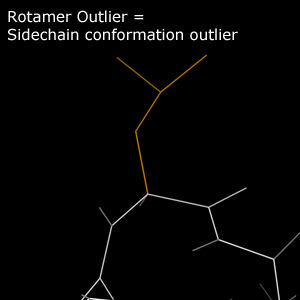
Outlier sidechains are traced in gold.
Usage notes
Specific rotamer assignment is more important in packed regions than on the unconstrained surface. That said, lack of packing constraint does not justify modeling of unrealistic rotamers. In low-resolution structures, it may be necessary to focus on mainchain validations before resolving sidechain packing.
References
Lovell, S. C., Word, J. M., Richardson, J. S., & Richardson, D. C. (2000). The penultimate rotamer library. Proteins, 40(3), 389-408. doi:10.1002/1097-0134(20000815)40:3<389::AID-PROT50>3.0.CO;2-2
Richardson, J. S. & Headd, J. J. (2012). Fitting tip: Rotamer correction, with backrubs. Comp. Cryst. Newsletter, 3, 29-30. PDF
Cβ Deviations
Deviation of Cβ from ideal position — backbone geometry check
Overview
The Cβ deviation is an assessment of protein backbone geometry. The ideal position of a residue's Cβ atom is calculated from the residue's main atoms. Sufficient deviation from the ideal position indicates a geometry error.
Results table
- Deviations ≥0.25Å are reported as outliers.
- Particularly severe deviations ≥0.5Å are flagged at the severe level.
Kinemage
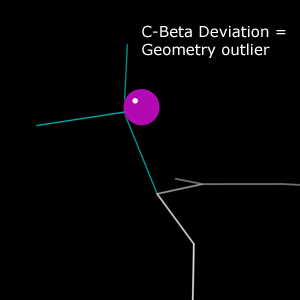
Cβ deviations appear as purple spheres. Each sphere is centered at the ideal Cβ position with its edge tangent to the modeled Cβ position. The radius equals the deviation, so the sphere size visually encodes severity.
Usage notes
Cβ deviations are a backbone geometry validation and, like general bond geometry validation, are always recommended.
References
Lovell, S. C., et al. (2003). Structure validation by Cα geometry: φ, ψ and Cβ deviation. Proteins, 50(3), 437-450. doi:10.1002/prot.10286
Arg χ5 Twist
Rotation of the Arg guanidinium about NE-CZ, which conjugation holds planar
Overview
The Arg guanidinium is a conjugated group, and that conjugation extends to the NE-CD bond, so CD belongs in the guanidinium plane: χ5 (CD-NE-CZ-NH1) sits at 0° or 180°. Rotating about NE-CZ costs conjugation roughly as sin² of the twist, so a few degrees are cheap and a large twist is not chemically reasonable. Rotamer evaluation covers only χ1-χ4, so this torsion has otherwise gone unchecked.
Well-ordered Arg in structures at 1.0Å or better twist by 3° on average and reach about 25°, with none past 30°. Twists of 30-90° do turn up in deposited models, and have become more common in recent years.
CD is more flexible than the rest of the group, and at atomic resolution a twist past 20° is occasionally clear in the density, which is why current restraints let CD move out of the plane more freely than the other atoms (Moriarty et al., 2020). An outlier between 20° and 30° is worth checking against the map; it is not necessarily an error.
Results table
- Twists over 15° are allowed (amber), as for rotamers: about 2% of well-ordered atomic-resolution Arg are this twisted. They are noted but not flagged.
- Twists over 20° are reported as outliers.
- Twists over 30° are flagged at the severe level.
- Search the residue table for
chi5to list Arg twisted past 15°.
The twist is the mean of the NH1 and NH2 dihedrals' distance from planar, so distortion within the guanidinium does not count. Outliers count toward the MP-Triage score, rising with sin² of the twist.
Kinemage
Outlier and severe Arg show the guanidinium in pink with a red flap, CD-NE-CZ, hinged off it along the NE-CZ bond. The angle between the flap and the pink plane is the twist: the more the flap stands up, the worse it is.
References
Moriarty, N. W., Liebschner, D., Tronrud, D. E. & Adams, P. D. (2020). Arginine off-kilter: guanidinium is not as planar as restraints denote. Acta Cryst. D76, 1159-1166. doi:10.1107/S2059798320013534
Cis-Peptide Evaluation
Trans/cis peptide bonds and twisted peptides
Overview
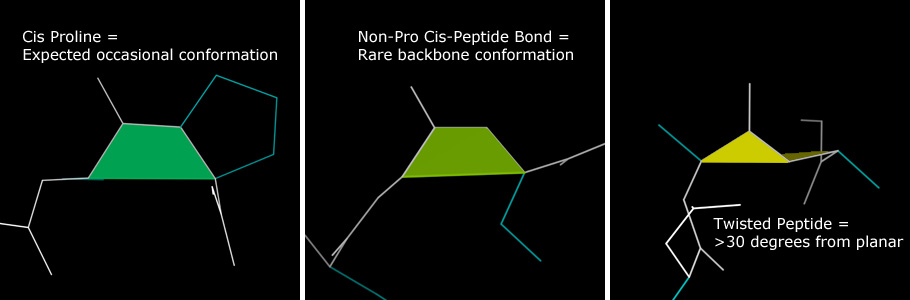
The peptide bond joining adjacent amino acids has partial double bond character, assuming either a planar trans or planar cis conformation. Trans is the default. The cis conformation is most common preceding proline: roughly 5% of Pro residues are cis. Only about 0.03% of non-proline residues are cis.
An additional category identifies residues with peptide bond dihedrals far (>30°) from the expected planar conformations. These are identified as twisted peptides.
Results table
Non-proline cis-peptides and all twisted peptides are identified as probable outliers. Non-proline cis-peptides do occur, but require strong support from the data. Cis-prolines are identified for convenience but are not marked as probable outliers.
Kinemage
All non-trans peptides are marked, with brighter colors indicating greater concern:
- Proline cis-peptides — sea green
- Non-proline cis-peptides — lime green
- Twisted peptides — yellow (the angle between component triangles indicates severity)
Usage notes
Cis-peptide validation is always relevant, especially in low-resolution structures and regions of uncertainty. Some methods can introduce extraneous cis-peptides in regions of ambiguous electron density.
References
Williams, C. J. & Richardson, J. S. (2015). Avoiding excess cis peptides at low resolution or high B. Comp. Cryst. Newsletter, 6, 2-6. PDF
CaBLAM Backbone Evaluation
Backbone quality at low resolution via Cα geometry and carbonyl orientations
Overview
CaBLAM validates protein backbone quality, especially secondary structure elements at resolutions 2.5Å and lower. It uses the relative orientations of adjacent carbonyl oxygens to identify errors in peptide plane orientation — errors common in low-resolution structures. CaBLAM uses Cα geometry (relatively reliable at low resolution) to identify secondary structure elements hidden by those errors.
Results table
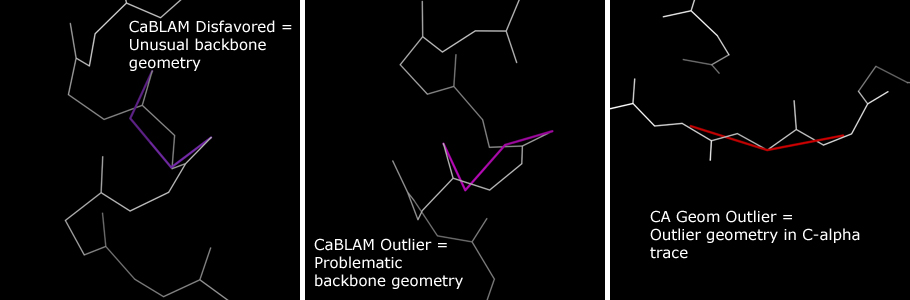
CaBLAM produces three residue identifications:
- CA Geom Outlier — the most severe category, indicating a problem with the Cα trace itself. Roughly analogous to bond geometry outliers.
- CaBLAM Outlier — a Cα geometry/peptide plane combination in the bottom 1% of observed behavior. Roughly analogous to Ramachandran Outliers in severity.
- CaBLAM Disfavored — in the bottom 5% of observed behavior. May have valid conformations, especially in loops, but should be treated with more suspicion than Ramachandran Allowed residues, particularly at low resolution.
Kinemage
CA Geometry Outliers are marked with red bars over the Cα virtual angle. CaBLAM Outliers (pink) and Disfavoreds (purple) are marked with bars tracing the carbonyl oxygen dihedral.
Usage notes
CaBLAM is designed for structures in the 2.5Å–4.0Å resolution range. Within this range, CaBLAM may be more helpful than Ramachandran analysis for correcting a structure. At higher resolutions, the errors CaBLAM assesses become less common. CaBLAM provides strong validation of secondary structure but can generate apparent false positives in loop regions. Up to 5% of residues are expected to be CaBLAM Disfavored.
References
Williams, C. J., Hintze, B. J., Richardson, D. C. & Richardson, J. S. (2013). CaBLAM: Identification and scoring of disguised secondary structure at low resolution. Comp. Cryst. Newsletter, 4, 33-35. PDF
RNA Validations
RNA Sugar Pucker Analysis
C3′-endo vs C2′-endo pucker validation by δ/Pperp cross-check
Overview
The ribose sugar in RNA adopts one of two main pucker conformations: C3′-endo and C2′-endo. The δ backbone dihedral (C5′-C4′-C3′-O3′) encodes the sugar pucker, with a mean δ of 84° for C3′-endo and 145° for C2′-endo. The perpendicular distance from the 3′ phosphorus to the glycosidic bond vector (Pperp distance) is correlated with the pucker: ≥2.9Å for C3′-endo and <2.9Å for C2′-endo. This validation identifies incorrectly modeled sugar puckers by cross-checking these two measures.
Only RNA residues are evaluated. DNA sugars are not checked, so a DNA structure reports no pucker outliers regardless of its geometry.
Results table
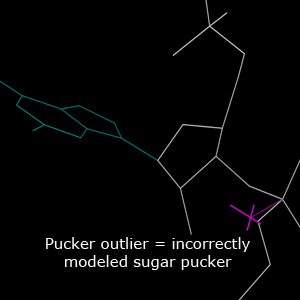
Two kinds of sugar pucker outliers are reported:
- δ outlier — the δ angle does not lie in the allowed range for the pucker recommended by the Pperp distance.
- ε outlier — the ε backbone angle lies outside 155°–310°, also indicative of pucker misfit.
Kinemage
Sugar pucker outliers are identified by a magenta cross pointing along the glycosidic bond vector, connected to the 3′ phosphorus. Purple crosses indicate ε-only outliers.
Usage notes
This is a very robust method for detecting pucker outliers and should always be used. It is especially useful at low resolution where electron density alone cannot determine the pucker. Very rarely, RNA residues may adopt unusual puckers, especially in active sites, but such cases require strong supporting evidence.
References
Jain, S., Kapral, G. J., Richardson, D. C. & Richardson, J. S. (2014). Getting the Pucker Right in RNA Structures. Comp. Cryst. Newsletter, 5, 4-7. PDF
Jain, S., Richardson, D. C. & Richardson, J. S. (2015). Computational Methods for RNA Structure Validation and Improvement. Methods Enzymol. doi:10.1016/bs.mie.2015.01.007
RNA Backbone Conformations
54 known backbone conformers — suites not matching any are outliers
Overview
RNA backbone is rotameric. The RNA Ontology Consortium has identified 54 all-angle conformers that the RNA backbone is most likely to adopt. These conformers are defined for the sugar-to-sugar backbone unit called a "suite." Each conformer has a two-character name. This validation identifies suites that do not belong to any known conformer.
Results table
For each suite matching a known conformer, the conformer name and its suiteness score (0–1, higher is better) are displayed. Suites not matching any conformer are reported as outliers. If any backbone dihedral individually falls outside its allowed range, the suite is marked as triaged.
Usage notes
The known conformers identify the most likely backbone conformations but do not cover all possibilities. Outlier suites can occasionally be valid and interesting. Do not force your structure to have no backbone conformer outliers. If a backbone conformation fits the electron density and has no other outliers (clashes, pucker outliers, geometry outliers), it is very likely valid.
References
Richardson, J. S., Schneider, B., Murray, L. W., Kapral, G. J., Immormino, R. M. et al. (2008). RNA Backbone: Consensus all-angle conformers and modular string nomenclature. RNA, 14(3), 465-481. PDF
Murray, L. W., Arendall, W. B., Richardson, D. C. & Richardson, J. S. (2003). RNA Backbone is Rotameric. PNAS, 100(24), 13904-13909. doi:10.1073/pnas.1835769100
Carbohydrate Validations
N-acetyl Twist
Rotation of a sugar's N-acetyl group about its amide bond, which conjugation holds planar
Overview
N-acetylglucosamine and its relatives (GlcNAc, GalNAc, ManNAc and sialic acid; codes NAG, NDG, NGA, A2G, BM3, SIA, SLB) carry an acetamido group whose amide is conjugated, just like a peptide bond. The ring carbon on the nitrogen (C2, or C5 in sialic acid) therefore belongs in the plane of the nitrogen, the carbonyl and the methyl. Rotating the group about the N-C(=O) bond breaks that conjugation, as an Arg χ5 twist does for the guanidinium.
Well-ordered N-acetyl groups in structures at 1.5Å or better twist by about 2° on average and stay within about 16°. Twists of 20-90° do turn up in deposited and re-refined models, especially in glycans.
Results table
- Twists over 15° are allowed (amber): noted but not flagged.
- Twists over 20° are reported as outliers, and those over 30° at the severe level.
- Search the residue table for
nacto list groups twisted past 15°.
The twist is measured as for Arg χ5, from the ring carbon's dihedrals to the oxygen and the methyl. Outliers count toward the MP-Triage score on the same curve.
Kinemage
Outlier and severe groups show the amide in pink with a red flap, ring carbon-N-C, hinged off it along the N-C bond. The angle between the flap and the pink plane is the twist.
Asn-glycan Link Twist
Rotation of an N-linked sugar about the Asn amide bond, which conjugation holds planar
Overview
In N-glycosylation the sugar's C1 bonds to the amide nitrogen (ND2) of Asn. That nitrogen stays planar, so C1 belongs in the plane of CB, CG, OD1 and ND2, on the side opposite CB, much as CA sits in a peptide plane. C1 itself is tetrahedral; it is the bond to it that should lie in the amide plane. Rotating C1 about CG-ND2 breaks the conjugation, as an N-acetyl twist does.
Well-ordered links in structures at 1.5Å or better twist by about 2.5° on average and stay within 20°. The link is found from the coordinates, a sugar C1 within 1.8Å of an Asn ND2, and charged to the sugar.
Results table
- Tiers as for Arg χ5: allowed over 15°, outlier over 20°, severe over 30°.
- The sugar's badge shows the worse of its N-acetyl and link twists, with both in its tooltip.
- Search the residue table for
linkto list links twisted past 15°.
Outliers count toward the MP-Triage score on the Arg χ5 curve.
Kinemage
Outlier and severe links show the Asn amide in pink with a red flap, C1-ND2-CG, hinged off it along CG-ND2.
Predicted Structure Metrics
pLDDT confidence score
Per-residue confidence from AlphaFold/ESMFold (0–100)
Overview
pLDDT (predicted Local Distance Difference Test) is a per-residue confidence metric produced by structure prediction tools such as AlphaFold and ESMFold. It ranges from 0 to 100 and is stored in the B-factor field of the coordinate file. Higher values indicate greater confidence in the predicted position.
Interpretation
| pLDDT range | Confidence | Color |
|---|---|---|
| >90 | Very high | ███ Dark blue |
| 70–90 | Confident | ███ Light blue |
| 50–70 | Low | ███ Yellow |
| <50 | Very low | ███ Orange |
Usage notes
Regions with pLDDT <70 should be interpreted with caution. These often correspond to intrinsically disordered regions, flexible loops, or areas where the prediction tool lacked sufficient information. Validation outliers in low-pLDDT regions are expected and do not necessarily indicate a fixable error in the prediction.
Use the "Low pLDDT Only" toggle in the results table to quickly filter for residues below pLDDT 70, and the "pLDDT" coloring button to visualize confidence in the 3D viewer.
References
Jumper, J., Evans, R., Pritzel, A., et al. (2021). Highly accurate protein structure prediction with AlphaFold. Nature, 596, 583-589. doi:10.1038/s41586-021-03819-2
Barbed wire categories
Categorize predicted structure regions by trustworthiness
Overview
The barbed wire analysis categorizes residues in predicted structures based on a combination of pLDDT confidence, local packing quality, and validation outlier density. This classification helps distinguish regions where the prediction can be trusted from regions that are prediction artifacts. The categories are defined by Williams et al. (2025).
Categories
| Category | Color | Description |
|---|---|---|
| Predictive | High pLDDT, good packing, few outliers. These regions can be trusted. | |
| Near-predictive | High pLDDT with good packing but some validation outliers. Generally reliable. | |
| Unpacked high pLDDT | High pLDDT but low packing density. Side-chain conformations may be unreliable even though the backbone is confident. | |
| Pseudostructure | Low pLDDT, low packing, few outliers. These regions likely lack defined structure and should not be interpreted as meaningful conformations. | |
| Barbed wire | Low pLDDT, low packing, high outlier density. These are prediction artifacts — the model has generated physically unreasonable geometry in an uncertain region. | |
| Unphysical | Low pLDDT, high packing, high outliers. Includes chain intersections and other severe artifacts where the model has placed chains in impossible configurations. |
Usage notes
Predictive and near-predictive residues are the regions where the prediction is most trustworthy and can be used for downstream analysis. Pseudostructure regions should be treated as lacking defined conformation; they often correspond to intrinsically disordered regions. Barbed wire and unphysical regions are outright artifacts and should be excluded from analysis.
Use the individual category buttons (Near-pred, Pseudostr, Barbed Wire, Unphysical, Unpacked) above the 3D viewer to highlight each category in the structure.
References
Williams, C. J., Chen, V. B., Richardson, D. C. & Richardson, J. S. (2025). Categorizing prediction modes within low-pLDDT regions of AlphaFold2 structures: near-predictive, pseudostructure and barbed wire. Acta Cryst. D, 81(10), 558-572. doi:10.1107/S2059798325007843
Reference
Summary Table Cutoffs
Green / yellow / red thresholds for each validation in the results summary
The summary table on the results page uses a green/yellow/red color scheme to indicate how a structure's statistics compare to expectations. The thresholds are:
| Category | Validation | Good | Caution | Warning |
|---|---|---|---|---|
| All-atom contacts | Clashscore | Percentile ≥ 66 | 66 > Percentile ≥ 33 | Percentile < 33 |
| Protein geometry | Poor rotamers | Outliers ≤ 0.3% | 0.3% < Outliers ≤ 1.5% | Outliers > 1.5% |
| Favored rotamers | Favored ≥ 98% | 98% > Favored ≥ 95% | Favored < 95% | |
| Rama outliers | Outliers ≤ 0.05% | 0.05% < Outliers ≤ 0.5% or count = 1 |
Outliers > 0.5% and count ≥ 2 |
|
| Rama favored | Favored ≥ 98% | 98% > Favored ≥ 95% | Favored < 95% | |
| Rama Z-score | |Z| ≤ 2 | 2 < |Z| ≤ 3 | |Z| > 3 | |
| MolProbity score | Percentile ≥ 66 | 66 > Percentile ≥ 33 | Percentile < 33 | |
| Cβ deviations >0.25Å | Count = 0 | 0 < Outliers < 5% | Outliers ≥ 5% | |
| Bad bonds | < 0.01% | 0.01% – 0.2% | ≥ 0.2% | |
| Bad angles | < 0.1% | 0.1% – 0.5% | ≥ 0.5% | |
| Peptide omegas | Cis prolines | No universal cutoffs for cis-proline | ||
| Cis non-prolines | ≤ 0.05% | 0.05% – 0.1% | > 0.1% | |
| Twisted peptides | Count = 0 | 0 < Twisted ≤ 0.1% | > 0.1% | |
| Nucleic acid | Sugar pucker outliers | Count = 0 | 0 < Outliers ≤ 5% | > 5% |
| Backbone conformations | Outliers ≤ 5% | 5% – 15% | > 15% | |
| Bad bonds | < 0.01% | 0.01% – 0.2% | ≥ 0.2% | |
| Bad angles | < 0.1% | 0.1% – 0.5% | ≥ 0.5% | |
| Low-resolution | CaBLAM outliers | ≤ 1% | 1% – 5% | > 5% |
| CA Geometry outliers | ≤ 0.5% | 0.5% – 1% | > 1% | |
| Planar groups | Planarity outliers | Count = 0 | Any outlier | |
| Arg χ5 twists >20° | Count = 0 | Any outlier | ||
| N-acetyl twists >20° | Count = 0 | Any outlier | ||
| Asn-glycan link twists >20° | Count = 0 | Any outlier | ||
The green-to-yellow cutoffs are set from statistics or properties of the validation methods. For example, the Ramachandran "Favored" category is defined by the contour containing the top 98% of residues, so the green-to-yellow cutoff is set at 98%.
The yellow-to-red cutoffs are set from experience to serve as guidelines for when structures become seriously troubled. For example, the Ramachandran "Favored" line turns red when fewer than 95% of residues fall within the 98% contour.
As always with structure validations, "perfect" is not the correct goal — "justified" is. Outliers are not necessarily mistakes. Especially in small structures, embrace yellow validation rows if you can explain and justify the outliers.